Map & Graph Settings#
The maps and graphs tab allows you determine the default behaviour for maps and graphs in your organisation’s control centre. We have set what we believe to be the optimum setup for most use cases, however specific use cases may dictate different defaults.
Individual operators can change their own specific settings if they wish to use them in a different way.
The following options can be set:
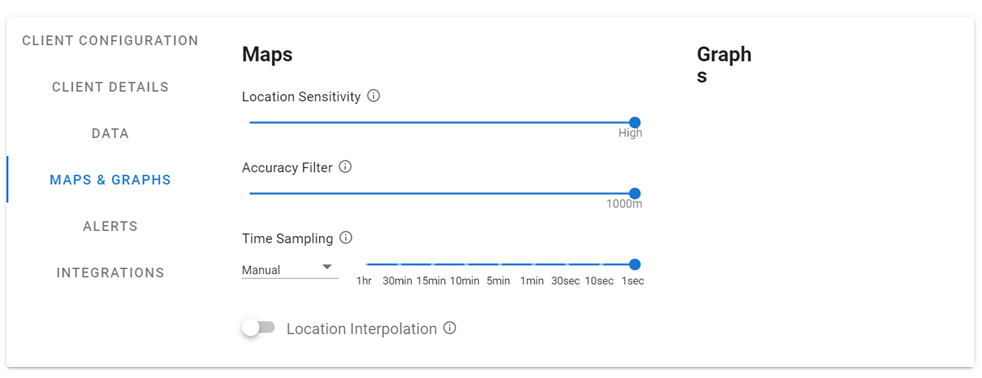
Location Sensitivity:
Filter out points based on the distance they have moved from the last plotted point. This also takes into account the maps current zoom level. Zooming in can reveal additional points. When set to maximum, no filtering is applied.
This can be adjusted using the slider.
Accuracy Filter:
Filter out points with an accuracy that exceeds the given distance threshold.
This can be adjusted using the slider.
Time Sampling:
The purpose of this setting is to find a balance between the granularity of the data provided and the performance of the page on a browser, which can slow down when a high number of map points are displayed.
When active, this filters out points that are close together in time. When “Auto” is selected, then a time filter will keep the number of points on the map under 200.
This can be adjusted using the slider when it is set to “Manual”.
The time sampling can also be “Disabled” which turns off the feature and displays every point received, but this can slow down your browser when viewing a map with a lot of data (eg: over a long time period). We recommend using the “Auto” setting.
Local Interpolation:
When enabled, the tracking position of the user on the map will be moved between two points based on an assumption of direct line of travel at an average speed between the two points. If turned off, then the user marker will remain at the initial point until jumping to the subsequent point at the time recorded.
This can be enabled/disabled using the toggle shown below.