Heart#
The heart screen displays user heart data over a specified timeframe. Heart Data can currently be recorded in the following ways:
- users enter it themselves through a paired SafeTrx Care phone App
- users themselves using a wearable that supports connection to a Bluetooth device (e.g. Sony mSafety)
- through a connected Withings account that is paired to one of their smart BP monitors
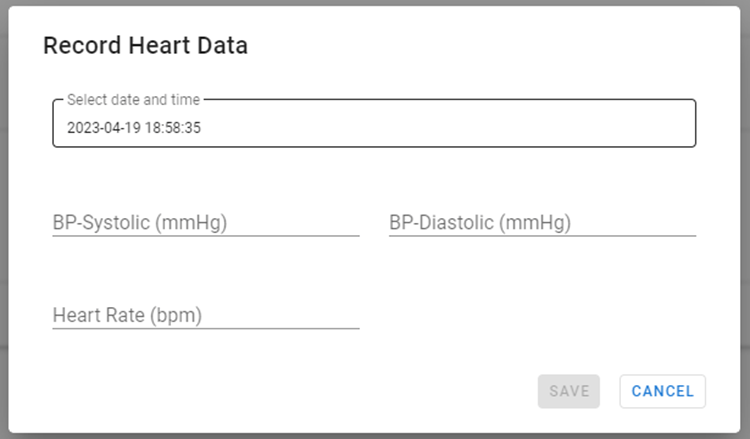
- by an operator on behalf of a user through the control centre itself by clicking the ‘record data’ icon

The required timeframe can be selected at the top of the page, using the common time selector, which has the following options
- Day – stats for the current day
- Week – stats for the current week
- 4 Weeks – stats covering the last 4 weeks
- Month – stats for the current month
- Custom – operator can select the start and end date to be covered
Where information is available it will be displayed on the appropriate charts.
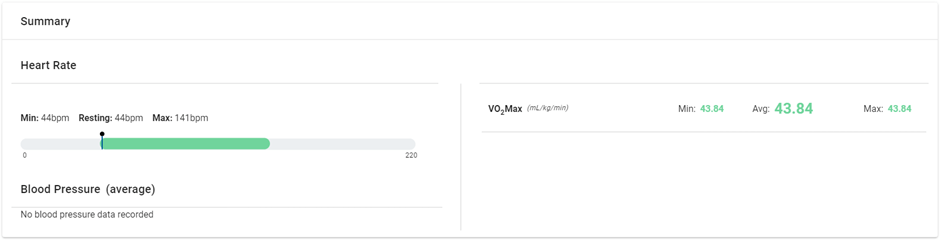
Summary Data
Includes summary information of heart rate and blood pressure ranges over the designated time period.
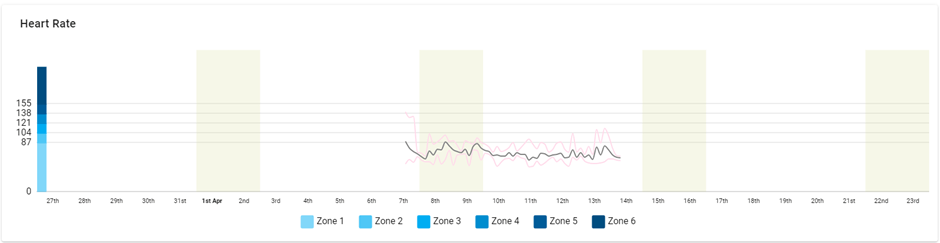
Heart Rate
This graph shows the heart rate over time and indicates where heart rate has entered into specific zones, which are defined based on age and sex.
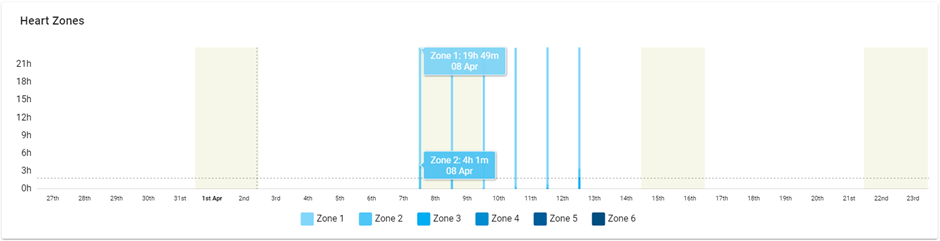
Heart Zones
This chart displays the amount of time spent in a specific zone for each day during the selected time period.
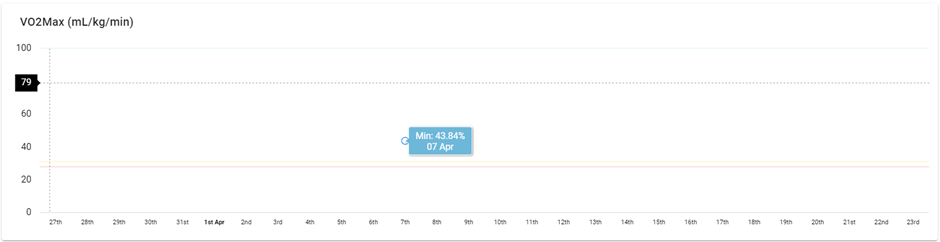
VO2 Max
This chart displays the VO2 Max variations over the selected timeframe.